Infographics are a great way to identify problems by visualising data.
Good infographics use visuals to show information. This means you can explain a complicated idea without relying on text.
Use the following process to create an infographic about sharks.
Structure and features
Ask students to consider all the different ways information can be presented. VisualizationUniverse shows lots of different ways to visualise data.
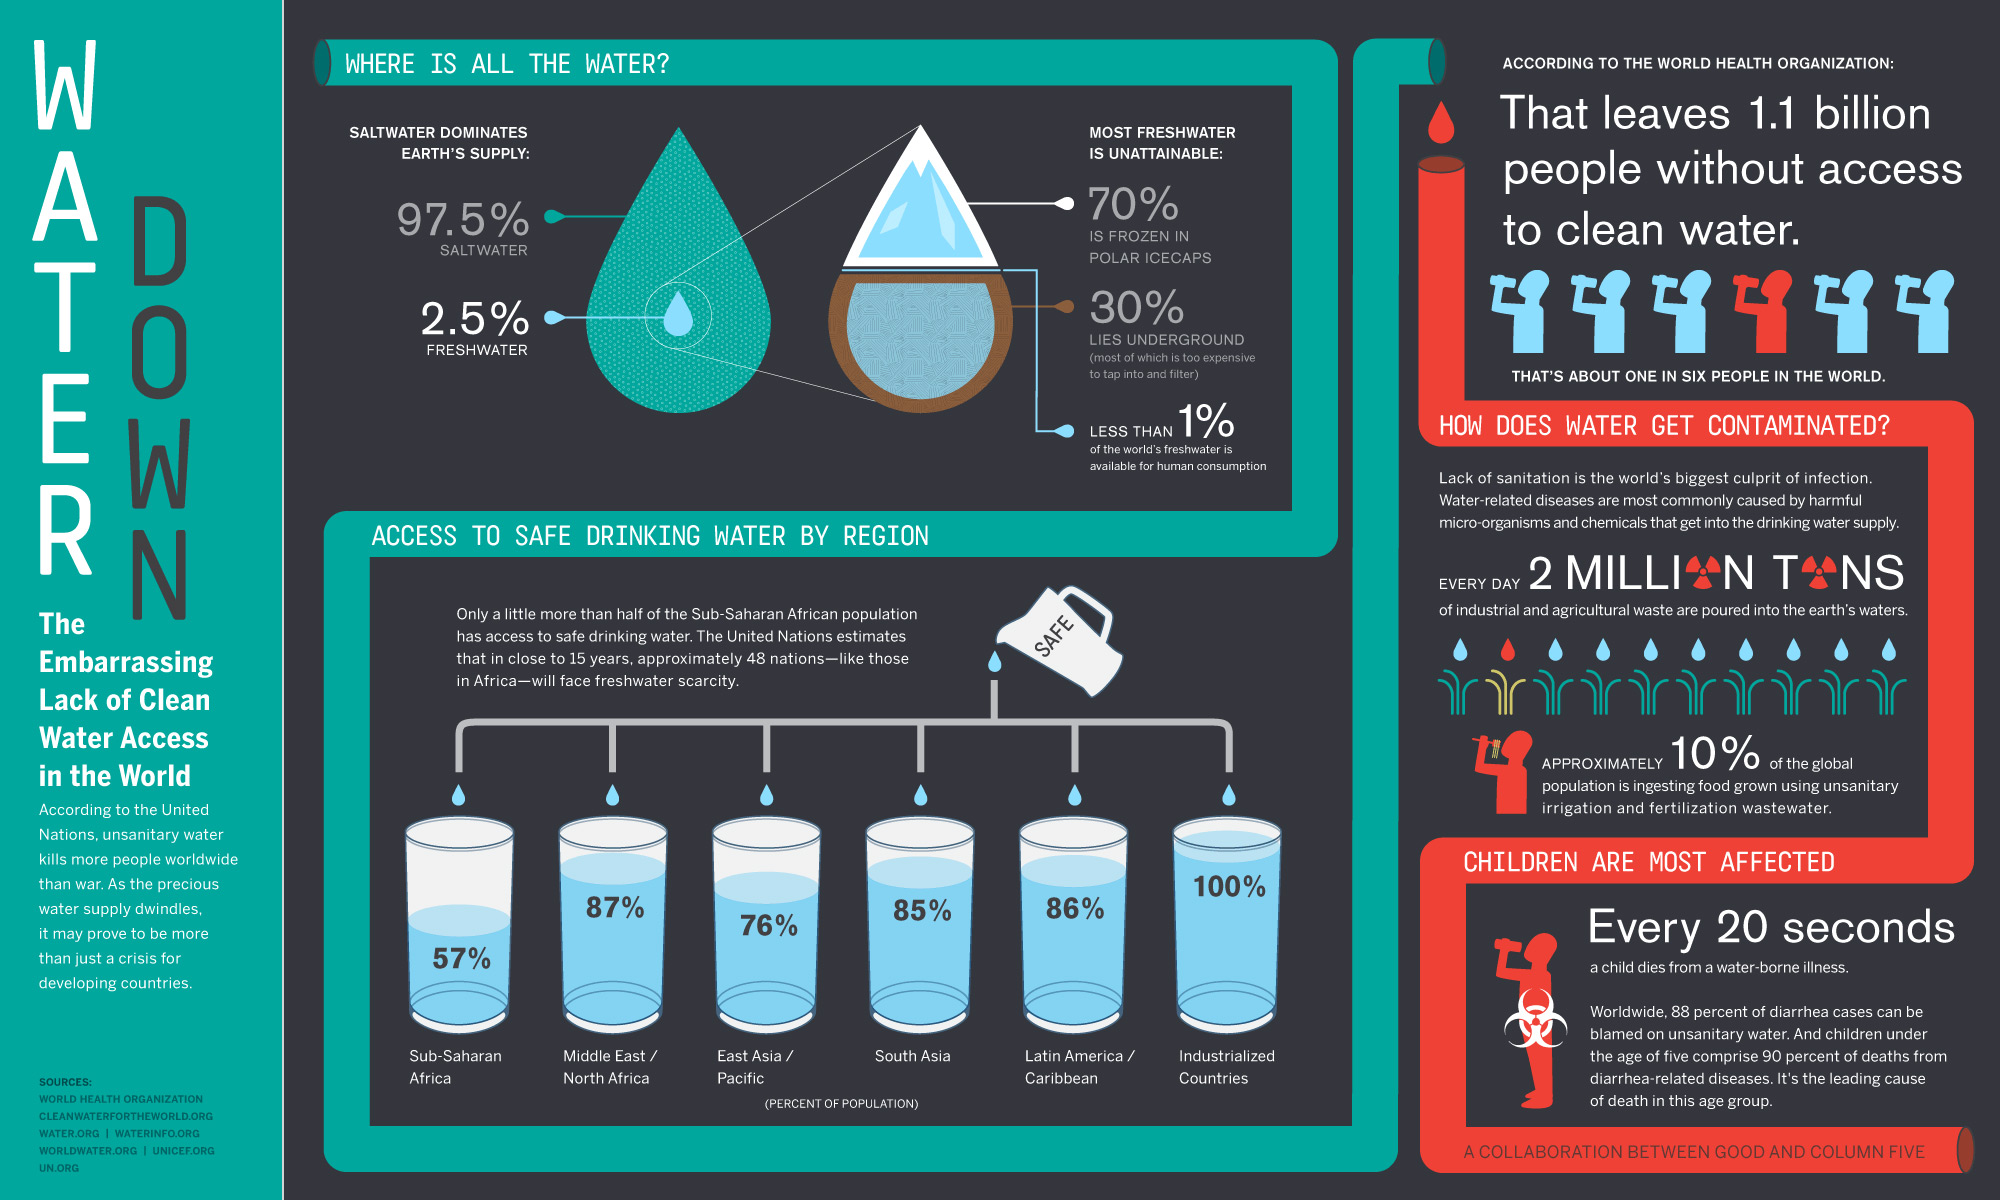
Here is a good example of an infographic about water. Use this as a model.
Ask students to explore these 10 facts about great white sharks.
Ask them to turn the information into an interesting infographic that shows what they've learnt about visualising data and sharks.
Reflection
Ask students:
- What do you notice about the data once it is visualised?
- Can you identify a problem that needs solving?
- How can sharks be protected?
Teacher notes
This resource aligns to the Digital Technologies subject.
The sub-strand it relates to is 'collecting, managing and analysing data'.


